Hi all,
I’m currently working with CfRadial data and trying to generate a CAPPI of reflectivity using Py-ART. I followed the example here: Compare PPI vs CAPPI — Py-ART 2.1.0 documentation
However, when plotting with
cappi_display = pyart.graph.RadarMapDisplay(cappi)
fig, ax = plt.subplots(1, 2, figsize=(13, 5))
…
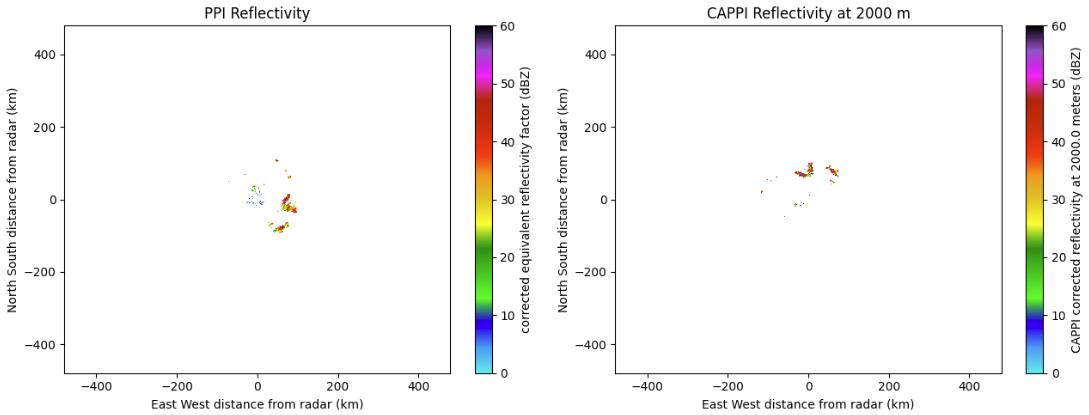
cappi_display.plot_ppi(“corrected_reflectivity”, vmin=0, vmax=60, ax=ax[1], cmap=“NWSRef”)
ax[1].set_title(“CAPPI Reflectivity at 2000 m”)
the reflectivity field seems to come out “rotated/misaligned” compared to the actual radar scan. Has anyone encountered this “rotation” issue when plotting CAPPI from CfRadial data? If so, is there a way/solution to this matter?
Lastly, is it possible to add a basemap (cartopy or otherwise) to the CAPPI for better georeferencing? A simple working example would be very helpful since it seems to “cut off” some of the data for some unknown reason.
Thanks a lot in advance for any guidance or example code!
Also see the sample CfRadial data that I used and plotted. CfRadial Data